En español, en français, em português.
The digital advance and the growth of online sales generate a lot of important data that, if analysed properly, can give you clues to improve and suggest opportunities that you may not have even considered. We are not talking about Big Data, so fashionable nowadays; we are talking about the fundamental data that reflects the reality of your sales and allow you to understand it better.
And precisely that is one of the key advantages of direct sales: that you own and have at your disposal all the sales process’ important data; from marketing campaigns to the booking process and even those who finally book to become guests. Moreover, you can have this data almost in real-time too, allowing for an optimal “time to market”. That is why distributors usually do not share too much data: they are afraid you will learn too much and take away some of their current buyers… who are actually looking for your hotel. Remember that they partly live off finding customers before you and convincing them to book with them instead of you.
What opportunities are we talking about? Some examples
- Detecting demand changes
Unforeseen changes in demand, especially in recent times due to covid-related travel restrictions, are pretty standard. New flights, promotional campaigns of the destination, events, etc., are factors that can activate the demand for specific dates of stay or specific markets. Detecting these cases early and understanding them well allows us to adjust rates (revenue management) or our Digital Marketing activity, for example.
- Converting requests that now are rejected
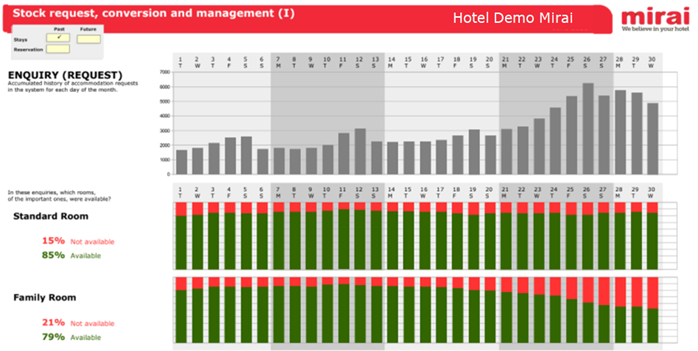
Imagine that you write down everything that customers ask about availability and rates (queries or requests to the booking engine) and that you know all details of what you “reject”: destination / hotel, dates, number of people and rooms and the reasons why you reject them (lack of availability, maximum occupancies of your rooms, conditions or restrictions, etc. If you analyse this in-depth, you can find solutions to accept many of these requests, some of which will end up being additional direct bookings. From experience, each type of rejected request has a potential solution. We explain it in this post.
- Finding attractive markets to boost
Suppose you have good data on the evolution and characteristics of the markets you work with. In that case, you can focus on those that are more attractive to you because they book earlier, have a longer stay or a better ADR, and design a good action plan to increase revenue in those that interest you.
- Find out what works and what does not
When it comes to online sales, you have to test, measure, analyse, adjust and retest. It is the basis of the experimentation and evolution of science, and it also applies to e-commerce. If you do it right, you will be able to focus on what works and fine-tune what does not to try again (or discard it if you think it is not worth it).
- Understanding how the different direct channels complement each other and fit together
Direct selling has several “legs” that complement each other and can achieve great results and good synergies if they work in a coordinated manner. We are mainly talking about the web, the call centre and the hotel, which, if coordinated, can achieve better results together than on their own. A good analysis will allow you to adjust your strategy in order to optimise the overall results.
- Comparing yourself to a group of similar hotels and discovering opportunities
In line with the “everything is relative” quote erroneously attributed to Einstein, your overall data may not give you the complete answers you need. Sometimes, to assess your numbers, you need to compare them versus a reference, which could be a group of hotels similar to yours. If this comparison is comprehensive, you can quickly focus on specific aspects that you consider to be priorities. All these opportunities can already be detected in our Mirai BI solution.
Pre-requirements
Before tackling this search for opportunities, you need to obtain the key data, ordered and well structured, in a tool that allows you to analyse and make the most of them. We refer to this information:
- Digital marketing campaigns and their return
AdWords, meta searchers, display… whatever you do, but make sure that the information is granular and allows you to analyse each campaign, market, audience / segment… and their performance.
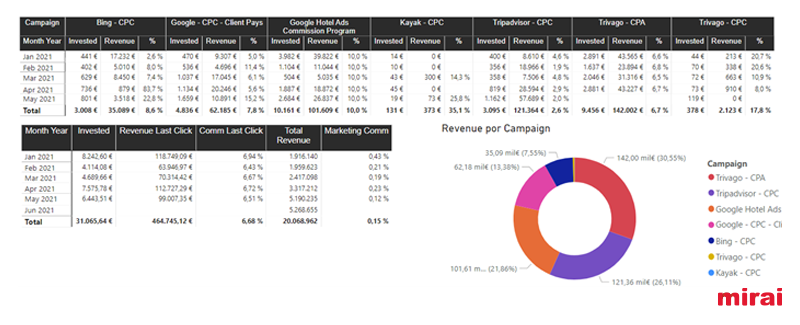
Information that allows you to perform aggregated analyses like this, by month and campaign.
- Demand
– Global on the one hand (example of markets – destinations, shared by Google):
– Hotel specific, which you can find in your Analytics (which has all the basic visits and browsing information) and in your engine (queries, availability and conversion):
- Reservations
This is the most important part and, at the same time, it should be easier to manage, since we talk about the data of your customers in your shop. The right thing would be to have the information at the reservation level, with all the possible details such as its origin, all the dates (of reservation, entry, departure), number of people, quantity and types of room, board, rate and deal reserved, prepayments, extras … and if the customer belongs to your club, any additional information you have.
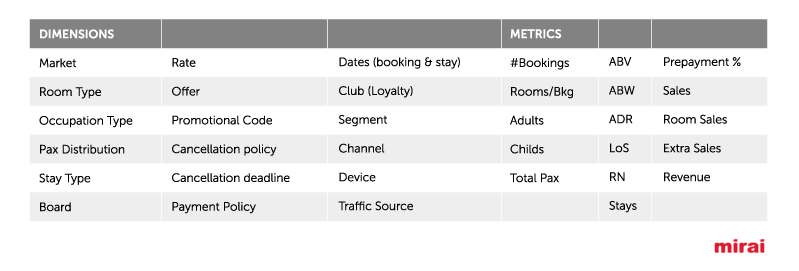
To give you a more specific idea, the data that emerges from the reservations that we process for the hotels allow us to have these dimensions (variables) of analysis and these metrics in Mirai BI:
The ability to analyse any metric by any combination of available dimensions offers endless possibilities.
How do you spot these opportunities?
Let’s explain in more detail how to analyse the available data to find some of the opportunities we mentioned earlier with some examples:
- Changes in demand according to market
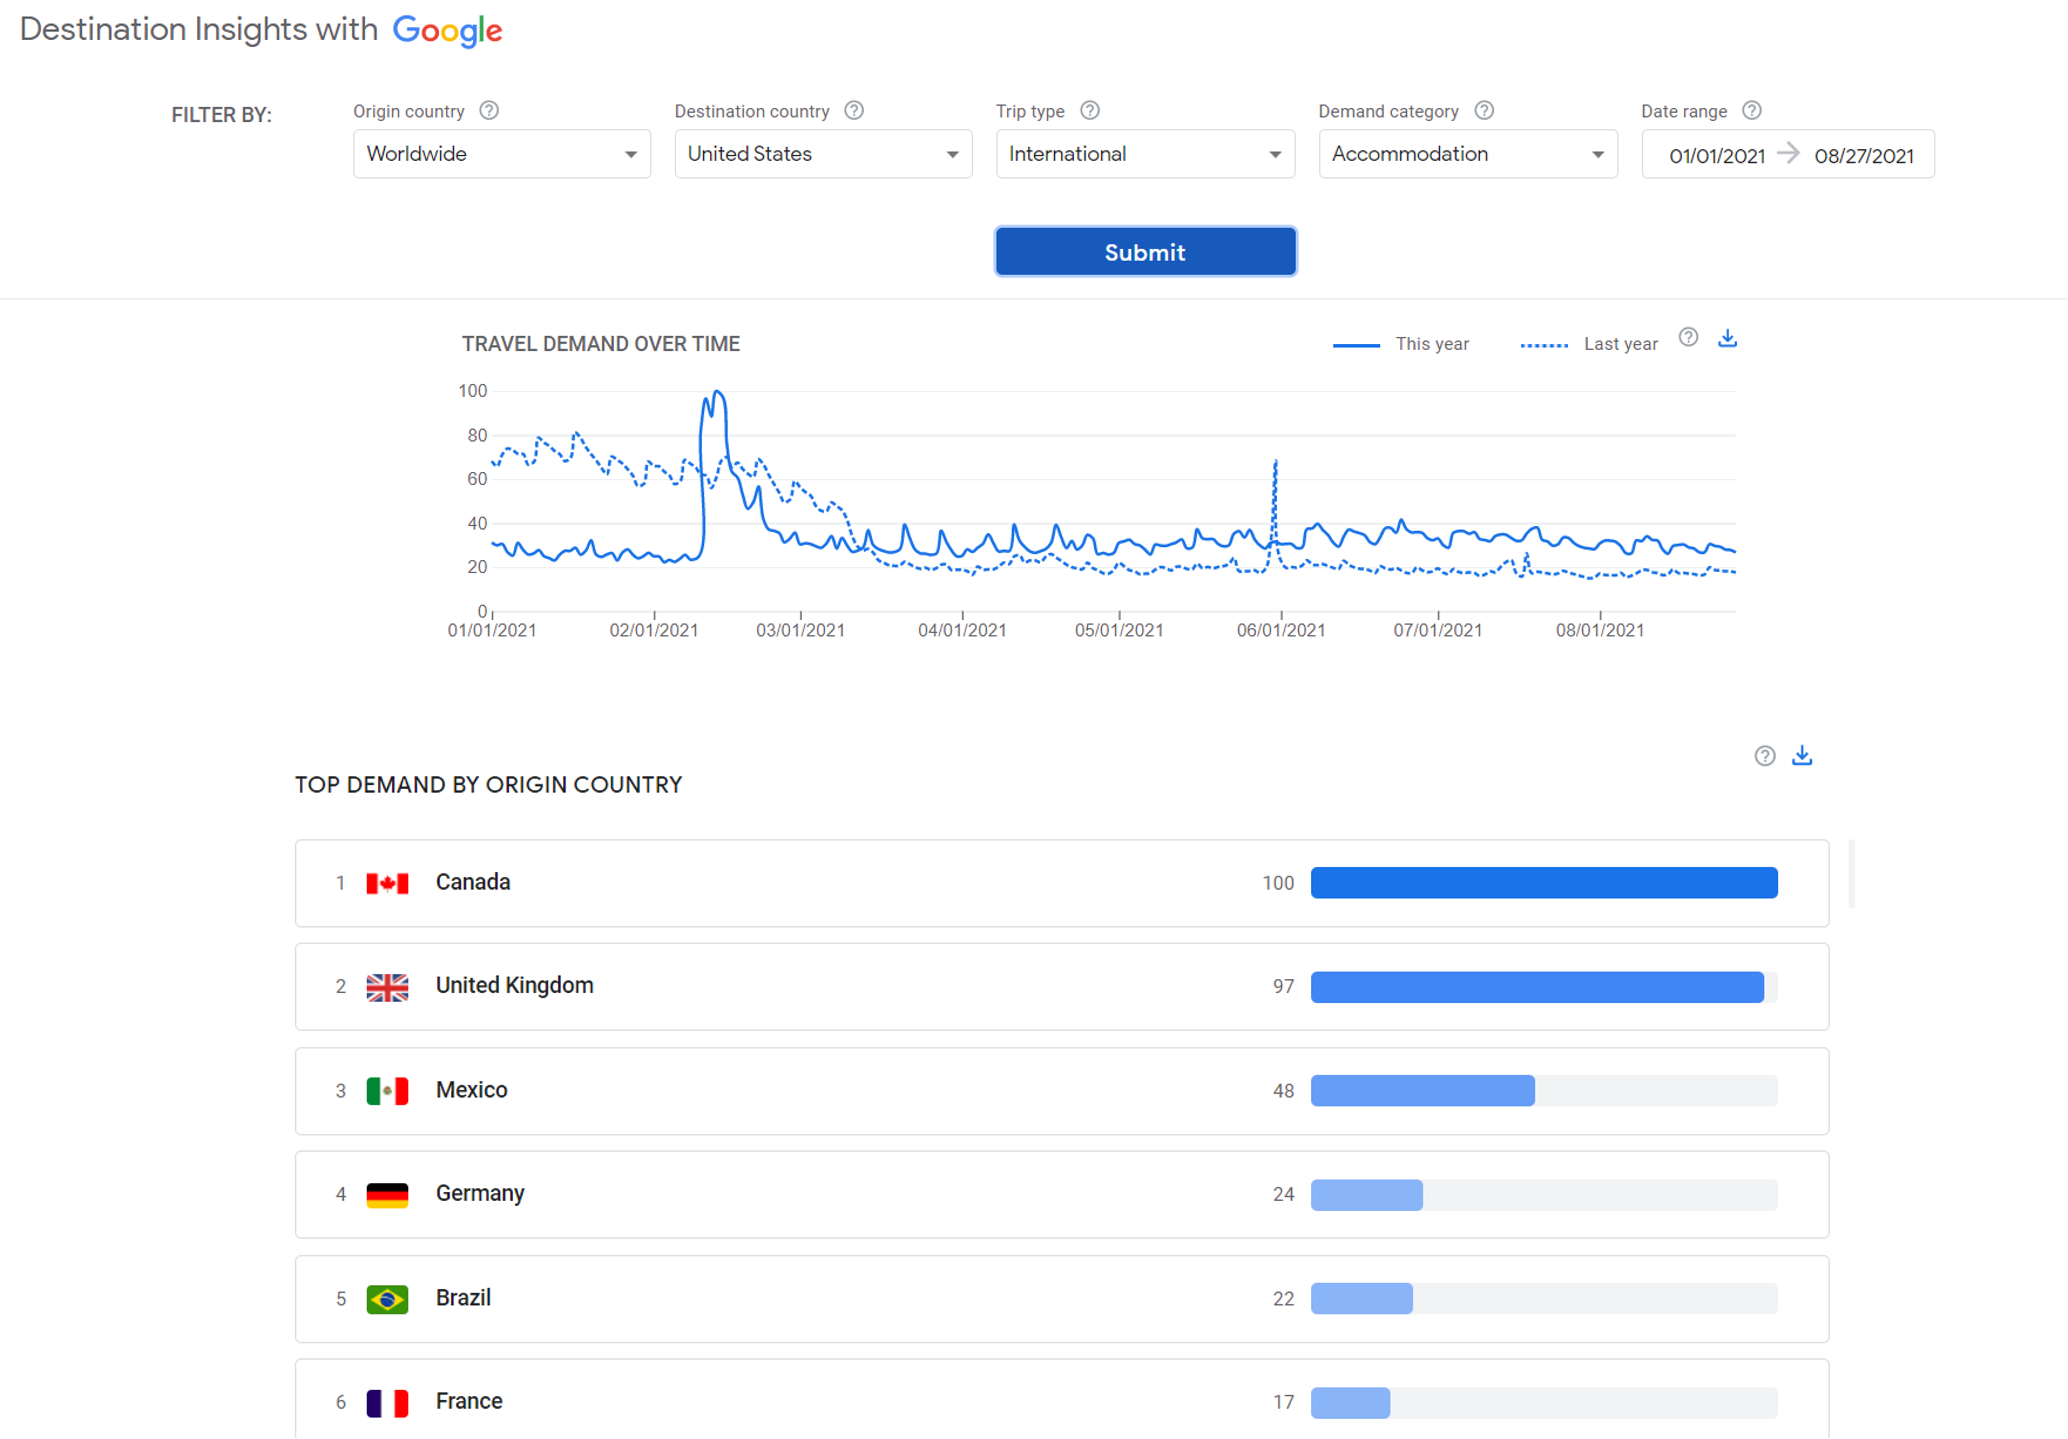
With the back and forth of covid infections and restrictions, it is key to be aware and quickly identify significant changes in demand in major markets, for example the UK, Germany and France. Let’s take a look at the Travel data that Google shares with everyone, publicly: https://travelinsights.withgoogle.com/
In the Destination Insights section, we see the following general chart with the markets that have the most interest in USA:
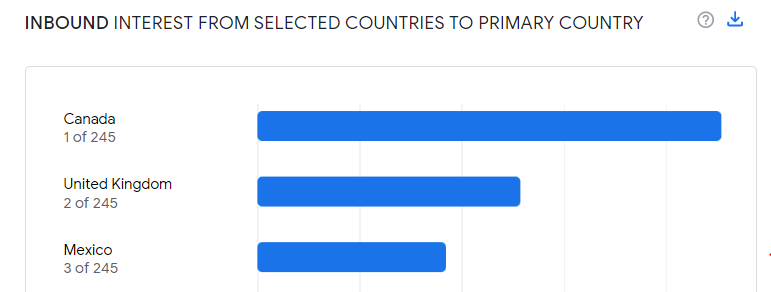
Let’s start by looking at the evolution of demand from Canada to USA:

We continue to analyse United Kingdom:

And finally Mexico:

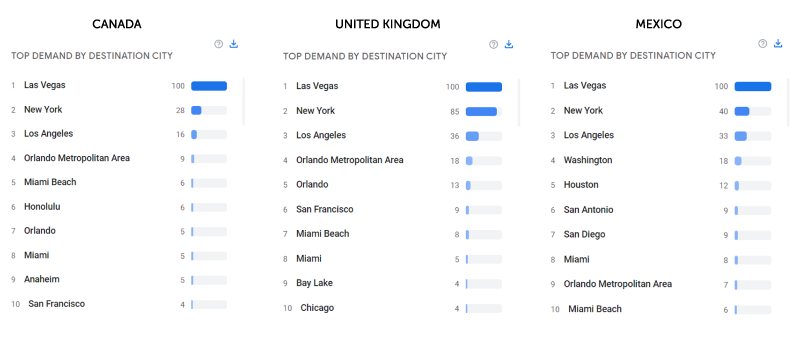
We can also see details of the Top 10 destinations for each of these markets:
When analysing these data, we should be cautious with the Canadian market, adjust the campaigns we have in United Kingdom and do something to make the most of the increase in demand in Mexico.
- Interesting markets to boost
We have just seen how to detect the variations in demand in the main markets, which serves, above all, to change the short term. If we also consider the longer term, the analysis and actions would be different. For example, if we analyse the main variables by market for the last few months, we would see something like this:
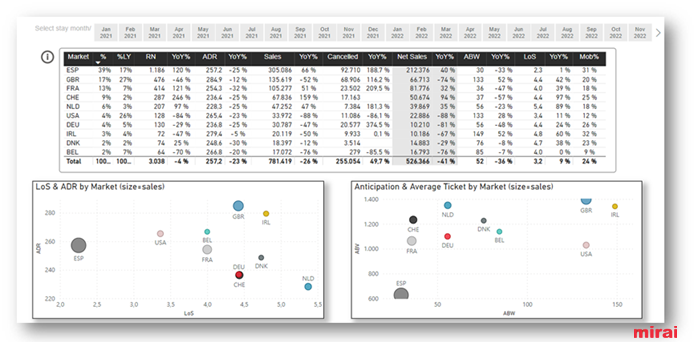
The growth of the Spanish market, which in weight is more than double that of the previous year, is obvious: almost the opposite of that in the British market, which falls 10 points to 17 %. France also stands out, but above all Switzerland, which is growing steadily.
In any case, with this picture, what markets would we be interested in boosting? Well, if we look at the charts, it will be easier for us. The one on the left represents the markets according to their ADR and LoS (average stay), with the size of the ball being its current weight. Spain, for example, is the largest, but its average stay is short (2.3) and its ADR is not the best (257 €). On the other hand, we can see that Ireland, for example, has a LoS of 4.8 (twice as much as Spain) and an ADR of almost 280 €. It has little weight now, but if we prioritise and boost it, perhaps next year it will be more important. That is what it is all about: identifying which markets to boost.
The second chart gives us a similar but complementary analysis. It represents the average value of the reservation (ABV) and how long in advance the reservation was made (ABW). Markets such as Ireland, Great Britain or the USA offer high booking values and reasonable average anticipation (which allows us to plan the season better).
- Comparing yourself to a group of similar hotels and discovering opportunities
Let’s see how a particular hotel compares to a group of similar hotels:
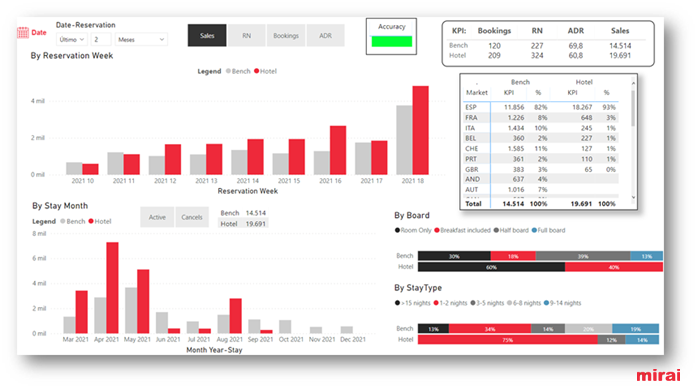
On the one hand, we see the hotel’s pickup vs its comparative group (bench) week by week. In this case, it seems that the hotel has improved a little in the last few weeks, great. Below we see the reservations per month of stay. It would be necessary to analyse why some months our hotel receives less than the group of reference.
On the other hand, it is evident that our hotel hardly has reservations from Italy or Switzerland, when the bench as many. Or on the other hand, if we focus on the boards, we see that the bench has a 39 % half board and that the hotel in question has nothing instead (it seems that it does not even offer it). Well, there you have an opportunity.
And another analysis is by type of stay, where we see that the hotel lacks weekly stays, which for the bench represent 20 %. Another opportunity!
Conclusion
Direct selling gives you a lot of valuable and almost immediate information that belongs to you. Your direct reservations’ data would be the starting point to which you can add the information of the visits to your website and queries to your booking engine to have a more complete picture. Add your digital marketing campaigns and their return and you will have a real diamond in the rough. If you order and upload this data in a good Business Intelligence tool, as we do in Mirai BI, you can analyse it and take advantage of it along with the complementary public data at your disposal (such as those of Google Travel).
Dedicate some time to this and soon you will see opportunities to improve your distribution, your direct sales and your hotel’s results.


