En español, en français, em português.
We are constantly updating our BI to provide you with as much information as possible about your direct sales, so that you can make better decisions. We have made a significant visual change and added new functionalities that represent an important qualitative leap. These are summarized as follows:
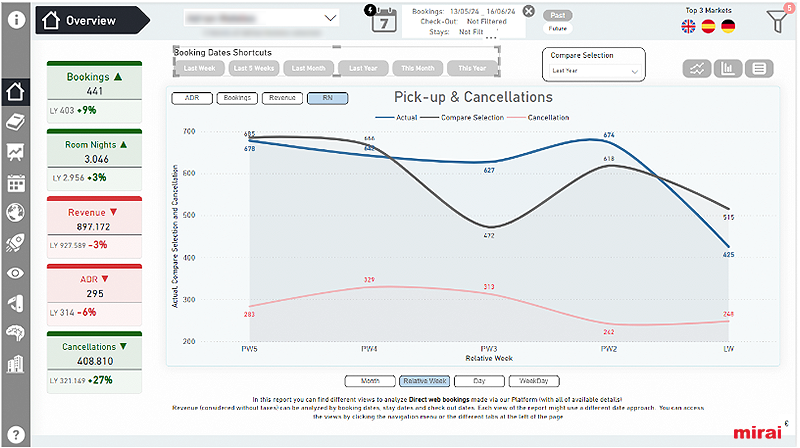
Improved design and usability
We have made our BI more modern and attractive. Calendar filters and other features have been redesigned to help you access information faster and easier, making it easier to navigate and understand, and improving your functional and visual experience.

Full table customization
Most datasets are now customizable, allowing you to select the KPIs you are interested in and see how they compare (year-over-year, absolute, or percentage). This allows you to tailor BI to your specific needs for more accurate and relevant insights.

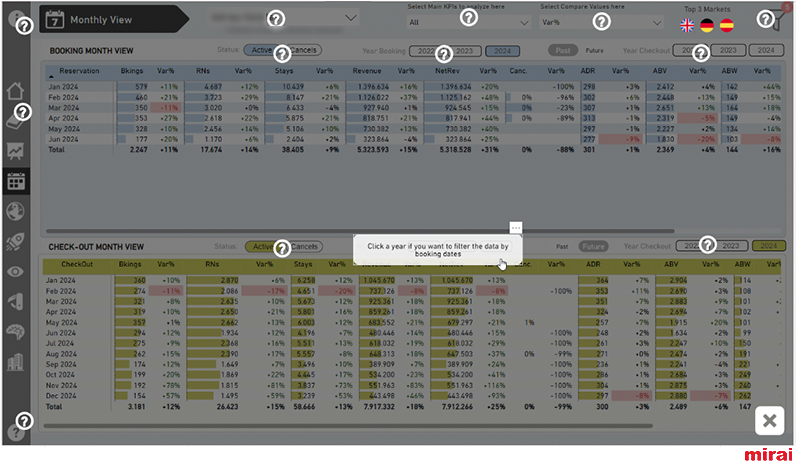
New onboarding layer
We have included an interactive onboarding system to help you learn all the new features of each sheet/report. This guide will help you quickly familiarize yourself with all the new features and get the most out of our BI.
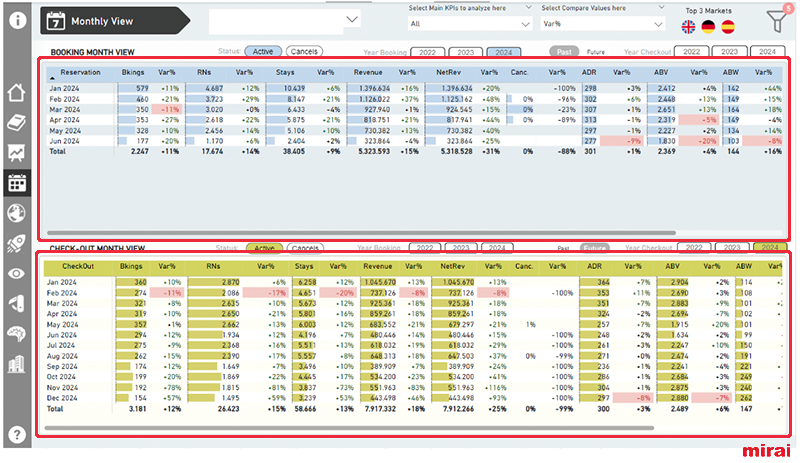
Colours with semantic value
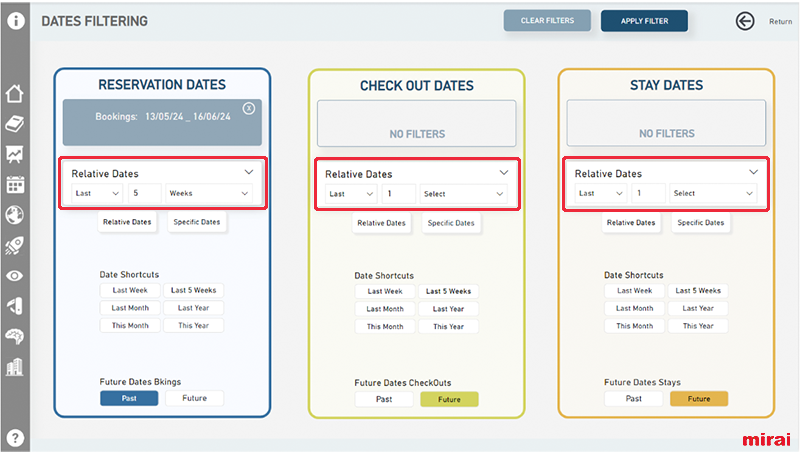
Our new look & feel uses colours with a specific meaning: yellow and orange for stay dates and blue for the booking dates. This allows you to differentiate between date queries at a glance, improving comprehension and navigation without having to read the legend or title.
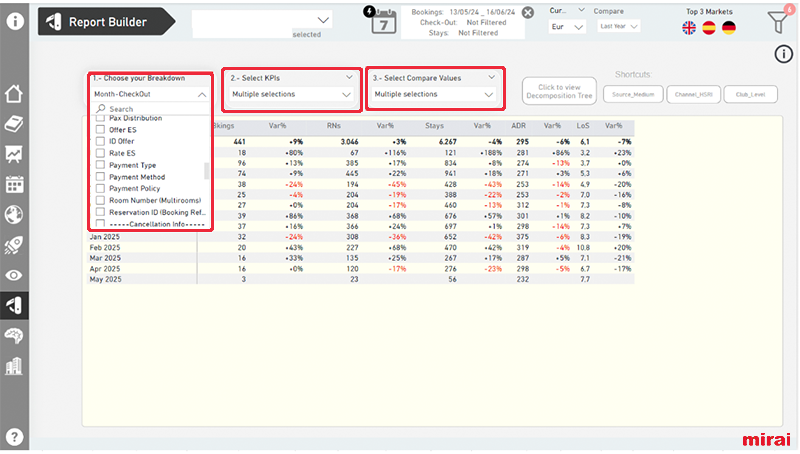
Detailed booking query
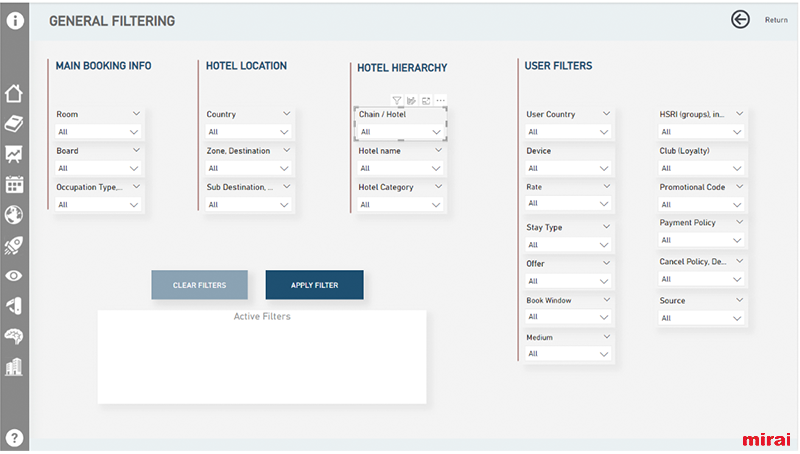
Remember that you can sort your bookings according to more than 25 different characteristics, including offers, room type, accommodation type and user country. You can also combine the different categories by pressing CTRL, giving you a detailed and multi-dimensional view of your data. This allows you to configure your bookings to display only the indicators that interest you. This means more information, better organisation and easier access.
Advanced filters
The filter icon allows you to quickly and easily filter multiple characteristics, giving you the flexibility to extract the information you need. Now you can easily see what you are filtering to save time and get exactly what you are looking for:
Shortcuts and improved navigation
We have added new shortcuts (top markets, different time periods) to make information more accessible with a single click and to make your navigation smoother and more efficient.

Data flexibility
It is now more intuitive and practical to work with relative dates (last 7 days, previous weeks), allowing you to easily adjust the analysis period according to your needs. Stay in full control of your timeframe analysis!
Enjoy the interactivity of the dashboard
Our BI is designed to support you in your decision-making process. We encourage you to use the interactive dashboard for a much richer and more efficient experience.

We encourage you to discover it for yourself and enjoy all the new features. If you have any questions, please contact your account manager.
New features of our BI tool:
- Booking source and medium are now available in your BI reports
- The most comprehensive upselling reports available in BI
- New web demand report in our BI.
- Possibility to compare vs 2021, 2020 or 2019
- Price competitiveness in Hotel Ads.
- Reporting of all your marketing investments (Ads and Metasearch).
- Benchmark of similar customers.
- Type of stay, occupancy, club, etc. as well as data analysis: general situation of your hotel, on the books (OTB), Pickup, Markets.
- Mirai BI collects the information from Mirai Rescue: Wait List, Cart Recovery and Retargeting


