En español, en français, em português.
We continue to improve our Business Intelligence tool, this time by adding a new report about your marketing campaigns. We have named it “Marketing performance” because it gives you all the information about your direct channel’s visibility and your campaigns’ performance in the different online marketing channels.
There are many advantages to this new report:
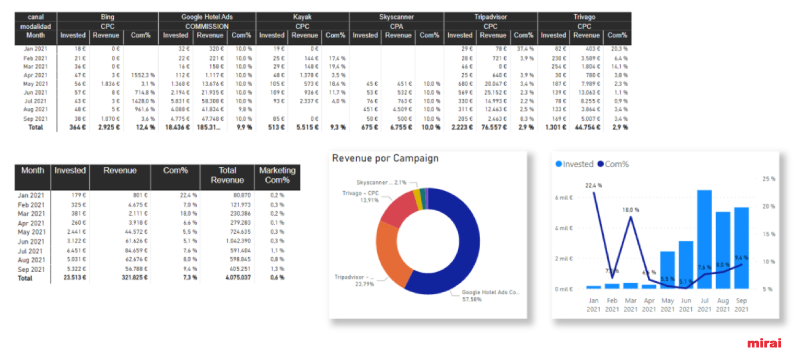
- It gives you a detailed overview of your investments and returns in different media (Ads, TripAdvisor, Google Hotel Ads, trivago, etc.) as well as a global view combining all of them.
- We speak a clear language, and all returns are converted into “commission” (% of cost with respect to revenue generated), which is the most common variable in hotel language. We avoid the ratios usually used by marketing agencies such as ROI or ROAS, which have little to do with traditional hotel vocabulary.
- Accessible 24×7 through our extranet (the same one where you manage all your hotel’s configuration). You won’t have to wait for us to send it to you as we used to. You will now be able to see each month’s information as soon as we get it (starting on the 12th of each month and ending on the 20th or 22nd).
- Complete transparency, so that you can make the best decisions at any moment.
- You will see the history of past months so that you can consult them whenever you need and without having to save the reports in any folder.
- We solve the complexity of investing in one currency and selling in another, showing the data in the currency your hotel sells in, thus facilitating calculations and decision making.
You will find our new “visibility report” on our extranet under Reports > BI.
Silo or global view
One of the great advantages of this report is that we show in a simple but efficient way all the investments, sales generated and returns of every online marketing channel in which you invest: Google Ads, TripAdvisor, trivago, Google Hotel Ads (in its different models: commission per stay, commission per conversion and CPC), Kayak and Skyscanner.
This overview is very interesting because it gives you a real picture of each channel and its performance. However, don’t get carried away by a “silo” picture; always pay more attention to the total aggregate. The user today is more omnichannel than ever and may click on several of your ads and end up booking after one of them. You must never forget that every channel helps and that assisted attribution (the channels the user interacted with get some credit for the sale) is just as important as the last click.
Per-hotel view for chains
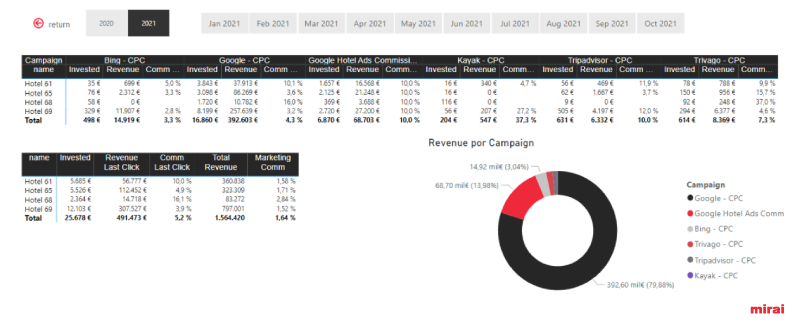
It is essential for chains to have a per-hotel report where to see the performance of all properties at a glance, with the option to go into the details of each hotel with a single click. In addition, for marketing and general management, it is vital to be able to see the chain’s total aggregate, including all its hotels. It’s all calculated and available on our extranet.
Breakdown of costs and revenues by channel and trend analysis
Here we show in a visual and very schematic way the breakdown of revenues generated by each channel as well as their weight and sales volume. With this information, we can understand what we are investing in and the efficiency we are achieving:
We also introduce an evolution over time with the most important variables of investment and commission (equivalent to ROI and ROAS), which helps us to understand the trend our investments are following.
Thanks to the new “visibility report” of our BI, you will save time and gain transparency and immediacy. Instead of spending hours pulling data and sorting them, now you can dedicate your time to analysing data and making the best decisions, always with the aim of optimising your online marketing campaigns and maximising your direct sales.
Mirai’s BI, an extra benefit of working with our booking engine and a powerful tool that brings you:
- The most comprehensive upselling reports available in BI
- More information, easier access and better organised
- New web demand report in our BI
- You can choose which year you compare your data with: -1, -2 or -3
- Price competitiveness in Hotel Ads
- Reporting of all your marketing investments (Ads and metasearch), as we show in this news.
- Benchmark of similar clients
- Type of stay, occupancy, Club, etc. as well as data analytics: general situation of your hotel, On the books (OTB), Pickup, Markets…
- Mirai BI collects the information from Mirai Rescue: Wait List, Cart Recovery and Retargeting
Get the most out of this report and make your direct sales more competitive! Your account manager can help you if you have any questions.


